-
Widget to genereate an Amazon list to your site...
-
biofuels
links for 2008-04-21
in Daily Links
It looks like this has been up since last summer, but today was the first I have heard of TagCrowd. TagCrowd is a web based tool that allows you to visualize word frequencies as a tag cloud. You can visualize web pages, text files, and contents of your clipboard and then embed the tag cloud in your page. This could be great for teachers to use to visualize frequently used vocabulary from text sources. Amazon has a similar feature, concordance, for books that are searchable in their Search Inside feature, but TagCrowd allows you to do this with any text. The example below is from the freely available (in public domain) text of Tom Sawyer by Mark Twain at the University of Virginia.
TagCrowd was created by Daniel Steinbock, a doctoral student in Design and Education at Stanford University. You can read more about TagCrowd, and some interesting uses ideas, on the TagCrowd Blog...
By way of NancyW and Twitter...
TagCrowd Example: The 100 most frequently found words in Tom Sawyer available at the University of Virginia...
Cabel Sasser is a software developer and one of the founders of Panic Software, the folks that make Transmit along with some other nice web development tools. Transmit is a great FTP utility for the Mac and a tool that I find myself using just about everyday. Cabel also does some other coding and his weblog, cabel.name is a good read for folks who like to keep up with smart independent software developers. (If you are interested in software design, his talk from C4 is very informative and entertaining...) This morning, David Warlick pointed to a nice little piece of Javascript that Cabel wrote that produces a nice visual effect when viewing images that have been posted to your web site. He calls it FancyZoom. Basically when a thumbnail link is clicked a larger version of the image appears as a call out. A very nice effect. Below is an example. Click the image to see the effect.


I finally updated my WordPress install to 2.5 for this blog, and several of my school blogs. So far things are working well. I like the new interface. It is a lot lighter and cleaner. I also like the new Gallery feature for uploading images. An example of which you can see below.


Remembering MLK's Prophetic 'Mountaintop' Speech
NPR has a nice roundup of information as we near the 40th anniversary of the death of Dr. King.
April 3, 1968, the Rev. Martin Luther King Jr. delivered his final public speech. In a crowded church in Memphis, Tenn., King spoke of the injustice felt by the city's sanitation workers, who were on strike protesting low pay and poor working conditions. But, speaking hours before his assassination, the civil rights leader went beyond that subject, touching on death and his own mortality...
Google has recently added some new features to its Google Docs Spreadsheets that now allow you to pull collaborative data from Google Spreadsheets into gadgets for display on iGoogle and also for embedding into other platforms. The Google Docs Blog has a post that outlines the new features.
One way a teacher might use these tools is to create a spreadsheet and form that surveys students on a particular question or series of questions. Using the form feature, one could easily link to the form from a classroom blog or via email. Students could follow the link to the survey, fill it out and in real time the results could be available to the teacher, displayed on a web page, or displayed for the class via a data projector. If available, students could use their cell phones or other web appliances to access the form and enter their responses. Kind of a low cost "clicker".
Below is a simple example. Here is a link to the form I created called : Favorite Team. It is a simple one question form regrading your favorite Oregon college team. If you follow the link you can fill out the form and watch the totals change below. To get the totals I used the countif command. Update: I'm having some trouble consistently getting the data below to update, but I have also embedded these on my iGoogle page and they update automatically. Will do some research and see why they aren't updating below...
 I am using something similar to keep track of my classroom visits and walk-thrus. I have created a Google Docs spreadsheet to document my classroom visits. I capture the date/time, teacher name, subject area being taught, and some other curricular information and also have a field for notes. I have the link to the form saved on my iPhone. When visiting classrooms I access the form on my phone and enter the information. Once I submit the form, the spreadsheet is automatically updated along with a bar chart that graphically displays the number of visits I have made to each particular classroom. Being able to visually see this running totals helps to guide my visits and assures that I visit each classroom.
The connected nature of applications, such as Google Docs, provides many interesting ways to collect, display and share data.
Technorati Tags: google docs, iphone
MapJack is a mapping web site that offers street views similar to Google Maps, but with a better interface. Currently it only offers views of San Francisco, Sausalito, and Chaiang Mai in Thailand. While similar to Google's Street Views its interface is much nicer and it also offers views from parks and walking paths, not just streets.
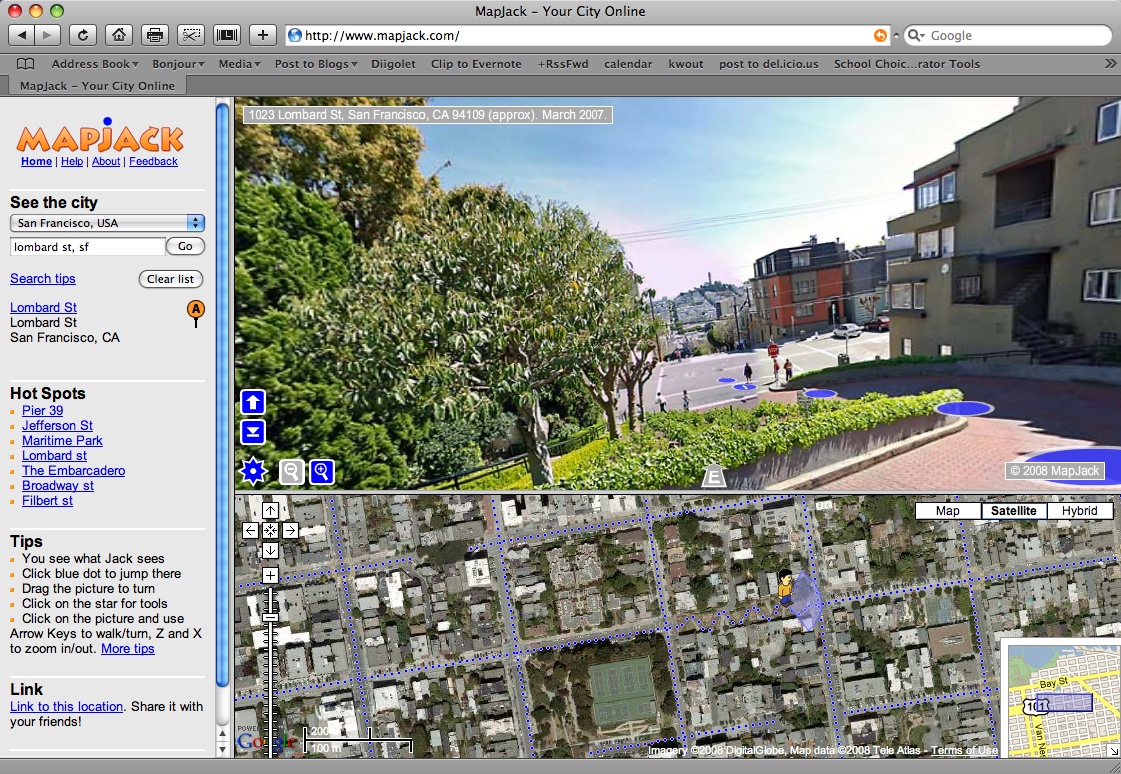
Lombard Street, San Francisco...